Difference between revisions of "User:Ankeshanand/GSoC14/proposal"
Ankeshanand (talk | contribs) m |
Ankeshanand (talk | contribs) (Overview, Current Status) |
||
| Line 16: | Line 16: | ||
==Brief Background== | ==Brief Background== | ||
| − | =Project | + | =Project Information= |
===Project Title=== | ===Project Title=== | ||
Benchmark Performance Database | Benchmark Performance Database | ||
===Abstract=== | ===Abstract=== | ||
BRL-CAD Benchmark Suite has been used over the years to analyse and compare a system's performance based on certain parameters. The goal of this project is to deploy a database and visualization website that provides multiple mechanisms to add new benchmark logs into the database and provide various forms of visualizations for the aggregate data. | BRL-CAD Benchmark Suite has been used over the years to analyse and compare a system's performance based on certain parameters. The goal of this project is to deploy a database and visualization website that provides multiple mechanisms to add new benchmark logs into the database and provide various forms of visualizations for the aggregate data. | ||
| + | ===Detailed Project Description=== | ||
| + | ====A Diagrammatic Overview==== | ||
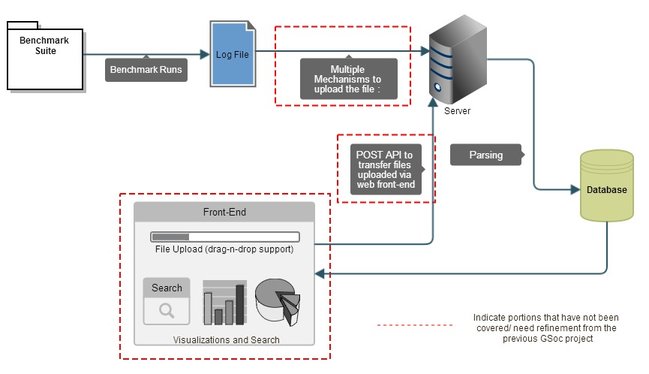
| + | Benchmark Runs produce a log-file which contains the results of the ray-tracing program on a bunch of sample databases, along with a linear performance metric, system state information and system CPU information. These log-files then need to be uploaded to a server via multiple mechanisms such as Email(Mail server), FTP, scp and an http API.There a parser reads the information from the log-file and subsequently stores it into a database. The database schema is ideally designed to index all the information in the log-file. The front-end pulls the aggregate data from the database and displays it in forms of various plots and tables. There is also a file upload mechanism via the web front-end as well as a search functionality which enables searches filtered to parameters such as machine descriptions, versions, results etc. | ||
| + | |||
| + | [[Image : Benchmark_overview_v3.jpg]] | ||
| + | |||
| + | ==== The current status of the Project ==== | ||
| + | There was an earlier GSoC project[1] which did a nice job of building a robust parser and capturing all the relevant information into the database. I plan to leverage the parser and database modules. The front-end is buily using the Python Bottle Framework and it Google Charts Library which is not robust for data-visualizations. I feel I could be more productive if I start my implementation of front-end from scratch, the details of which are highlighted in further sections. | ||
Revision as of 12:45, 18 March 2014
Contents
Personal Information
| Name | Ankesh Anand |
| Email Address | ankeshanand1994@gmail.com |
| IRC(nick) | ankesh11 |
| Phone Number | +91 8348522098 |
| Time Zone | UTC +0530 |
Brief Background
Project Information
Project Title
Benchmark Performance Database
Abstract
BRL-CAD Benchmark Suite has been used over the years to analyse and compare a system's performance based on certain parameters. The goal of this project is to deploy a database and visualization website that provides multiple mechanisms to add new benchmark logs into the database and provide various forms of visualizations for the aggregate data.
Detailed Project Description
A Diagrammatic Overview
Benchmark Runs produce a log-file which contains the results of the ray-tracing program on a bunch of sample databases, along with a linear performance metric, system state information and system CPU information. These log-files then need to be uploaded to a server via multiple mechanisms such as Email(Mail server), FTP, scp and an http API.There a parser reads the information from the log-file and subsequently stores it into a database. The database schema is ideally designed to index all the information in the log-file. The front-end pulls the aggregate data from the database and displays it in forms of various plots and tables. There is also a file upload mechanism via the web front-end as well as a search functionality which enables searches filtered to parameters such as machine descriptions, versions, results etc.
The current status of the Project
There was an earlier GSoC project[1] which did a nice job of building a robust parser and capturing all the relevant information into the database. I plan to leverage the parser and database modules. The front-end is buily using the Python Bottle Framework and it Google Charts Library which is not robust for data-visualizations. I feel I could be more productive if I start my implementation of front-end from scratch, the details of which are highlighted in further sections.
