Difference between revisions of "User:Stattrav/GSoC2012 log"
From BRL-CAD
(Update of the dev logs) |
m |
||
| (41 intermediate revisions by the same user not shown) | |||
| Line 1: | Line 1: | ||
| − | === | + | ===22 August 2012=== |
| − | + | * Tried running the bottle app on multi-threaded and asynchronous servers. Tested out Tornado. Currently running on python-paste | |
| − | |||
| − | * | ||
| − | |||
| − | === | + | ===20 August 2012=== |
| − | * | + | * Documentation |
| + | |||
| + | ===17-19 August 2012=== | ||
| + | * Rolled out the crude website which is hosted at http://88.198.223.105:8080/ | ||
| + | * Upload page working on the localhost but buggy on the VPS | ||
| + | * Documentation | ||
| + | * Full of bugs, project immature | ||
| + | |||
| + | === 15-16 August 2012 === | ||
| + | * Added views for the plots and configured the output to be presented via the template in the view | ||
| + | * Made changes to existing folder structure for the Bottle app to run | ||
| + | * Configured and made a run_server.py script | ||
| + | * Source is at https://bitbucket.org/suryajith/benchmark/src | ||
| + | * Awaiting Dr.Rai's perusal of the patches. | ||
| + | [[Image:absavgperfvsimagescomb.png|900px]] | ||
| + | [[Image:absavgperfvsimages2.png|900px]] | ||
| + | [[Image:absavgperfvsimages1.png|900px]] | ||
| + | [[Image:absavgperfvsarchpermhz.png|900px]] | ||
| + | [[Image:absavgperfvsarch.png|900px]] | ||
| + | |||
| + | |||
| + | ===12-14 August 2012=== | ||
| + | * Necessary changes in the db structure for the data needed for graphs | ||
| + | * Necessary changes to the Parser script | ||
| + | * Implemented | ||
| + | ** Absolute Performance vs Reference images over various architectures | ||
| + | ** Average Performance vs Architectures | ||
| + | ** Average Performance per CPU MHz vs Architectures | ||
| + | ** Absolute Performance vs CPU over various architectures | ||
| + | ** Absolute Performance vs CPU over various images for specific architecture | ||
| + | * Forms for comparision between various architectures | ||
| + | * Three modes of data displayed : text, table, graph | ||
| + | * Below are some examples of the graphs generated from the data in the database | ||
| + | [[Image:Perfvsimages.png|900px]] | ||
| + | [[Image:absavgperfpermhz.png|900px]] | ||
| + | [[Image:Absavgperf.png|900px]] | ||
| + | |||
| + | ===8-11 August 2012=== | ||
| + | * MVC framework using bottle | ||
| + | * Developed controllers for upload and basic charting libraries | ||
| + | * Charting libraries : Wrapper over the GCharts by generating and thus embedding the js code | ||
| + | |||
| + | ===1-6 August 2012=== | ||
| + | * More failed attempts at working with mediawiki | ||
| + | |||
| + | ===28-29 July 2012=== | ||
| + | * Implemented a custom form renderer. | ||
| + | * Results to be integrated. | ||
| + | |||
| + | ===21 July 2012=== | ||
| + | * Realized that simpleforms do not help much and have begun writing the forms natively in PHP. | ||
| + | |||
| + | ===20 July 2012=== | ||
| + | * Still figuring out the forms and the implementation of the actions | ||
| + | |||
| + | ===17-18 July 2012=== | ||
| + | * Playing around with the Simple forms extension. Naive html forms wouldn't help as the action can't be hard coded. | ||
| + | * It has some issues with mediawiki 1.20(alpha) due to some deprecations in the mediawiki codebase but figured out a few of them. | ||
| + | |||
| + | |||
| + | ===11-12 July 2012=== | ||
| + | * Upload form on the special page. | ||
| + | * Read up on Google charts embedding. Thoughts on the features required for the frontend. | ||
| + | |||
| + | ===9-10 July 2012=== | ||
| + | * Documentation and fixing the flow. logging cleanup. | ||
| + | * Frontend | ||
| + | |||
| + | ===5 July 2012=== | ||
| + | * Read up the forms implementation for the frontend of mediawiki extension | ||
| + | |||
| + | ===3 July 2012=== | ||
| + | * Web API set up. Mail has been sent to the mailing list asking folks to submit the logs through the API and mail. | ||
| + | * Documentation, implement logging through out. | ||
| + | * Read up about frontend forms for upload and data request. | ||
| + | * The frontend is being setup through a special page which is the view part of the mediawiki extension. | ||
| + | |||
| + | ===1 July 2012=== | ||
| + | * Setting the demo server up. It is hosted at http://88.198.223.105 and that is being configured now for the demo purposes. | ||
| + | * Documentation of the work | ||
| + | |||
| + | ===30 Jun 2012=== | ||
| + | * Integrating all the things worked on. Testing the process. | ||
| + | |||
| + | ===29 Jun 2012=== | ||
| + | * | ||
Latest revision as of 09:20, 22 August 2012
Contents
- 1 22 August 2012
- 2 20 August 2012
- 3 17-19 August 2012
- 4 15-16 August 2012
- 5 12-14 August 2012
- 6 8-11 August 2012
- 7 1-6 August 2012
- 8 28-29 July 2012
- 9 21 July 2012
- 10 20 July 2012
- 11 17-18 July 2012
- 12 11-12 July 2012
- 13 9-10 July 2012
- 14 5 July 2012
- 15 3 July 2012
- 16 1 July 2012
- 17 30 Jun 2012
- 18 29 Jun 2012
22 August 2012[edit]
- Tried running the bottle app on multi-threaded and asynchronous servers. Tested out Tornado. Currently running on python-paste
20 August 2012[edit]
- Documentation
17-19 August 2012[edit]
- Rolled out the crude website which is hosted at http://88.198.223.105:8080/
- Upload page working on the localhost but buggy on the VPS
- Documentation
- Full of bugs, project immature
15-16 August 2012[edit]
- Added views for the plots and configured the output to be presented via the template in the view
- Made changes to existing folder structure for the Bottle app to run
- Configured and made a run_server.py script
- Source is at https://bitbucket.org/suryajith/benchmark/src
- Awaiting Dr.Rai's perusal of the patches.
12-14 August 2012[edit]
- Necessary changes in the db structure for the data needed for graphs
- Necessary changes to the Parser script
- Implemented
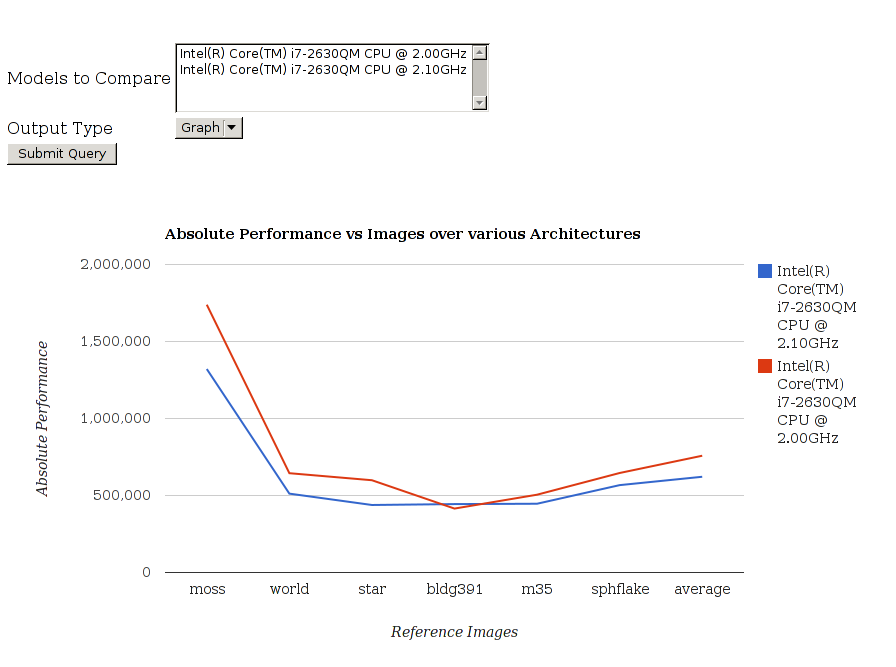
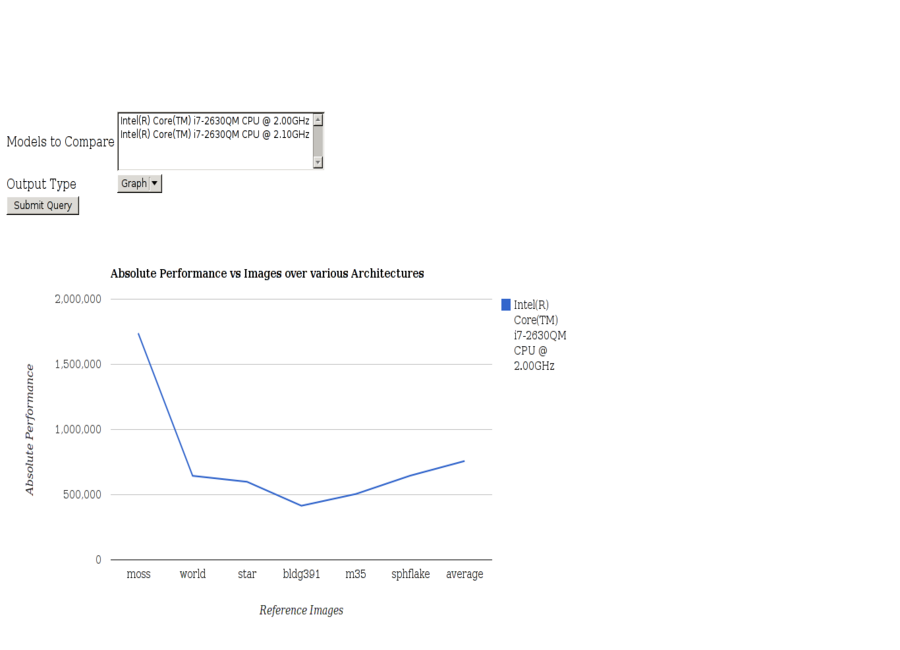
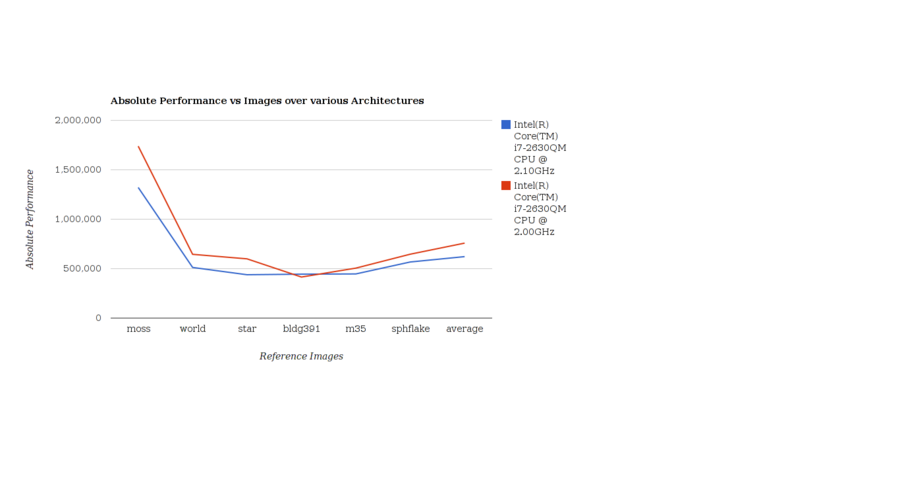
- Absolute Performance vs Reference images over various architectures
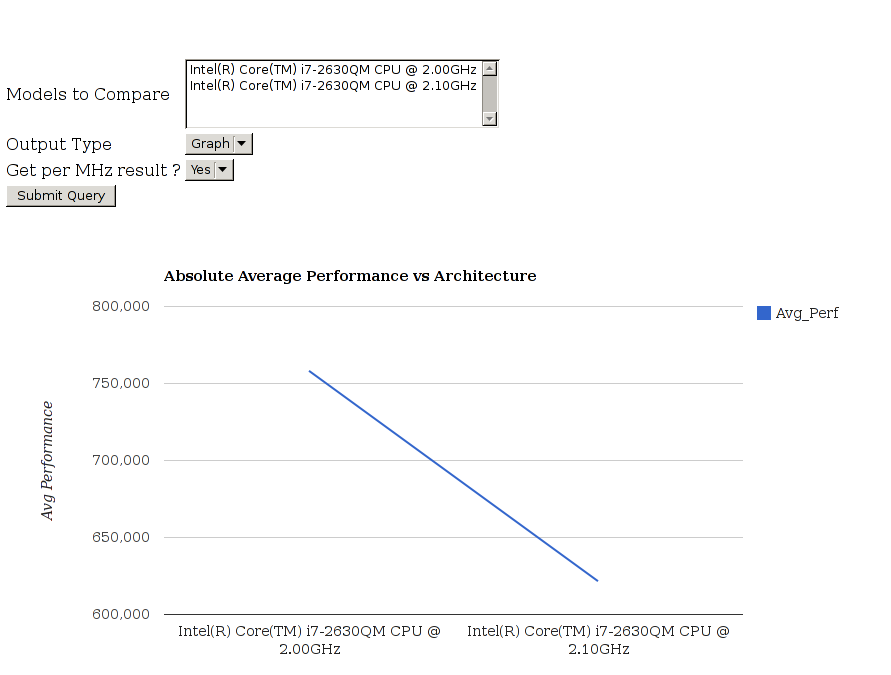
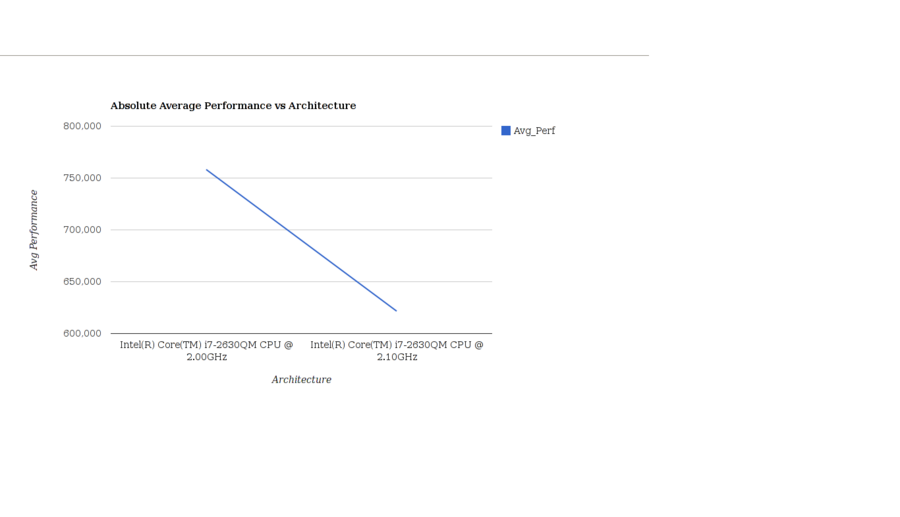
- Average Performance vs Architectures
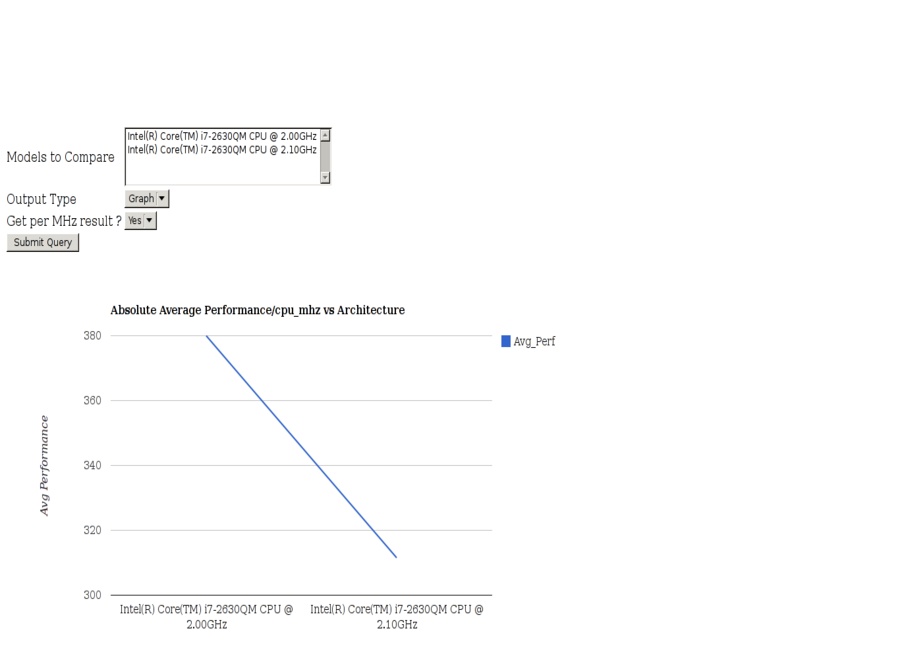
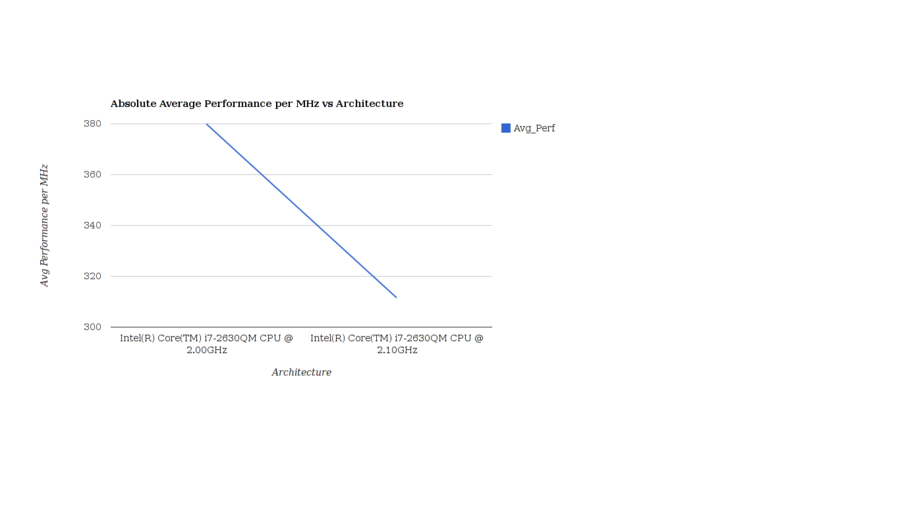
- Average Performance per CPU MHz vs Architectures
- Absolute Performance vs CPU over various architectures
- Absolute Performance vs CPU over various images for specific architecture
- Forms for comparision between various architectures
- Three modes of data displayed : text, table, graph
- Below are some examples of the graphs generated from the data in the database
8-11 August 2012[edit]
- MVC framework using bottle
- Developed controllers for upload and basic charting libraries
- Charting libraries : Wrapper over the GCharts by generating and thus embedding the js code
1-6 August 2012[edit]
- More failed attempts at working with mediawiki
28-29 July 2012[edit]
- Implemented a custom form renderer.
- Results to be integrated.
21 July 2012[edit]
- Realized that simpleforms do not help much and have begun writing the forms natively in PHP.
20 July 2012[edit]
- Still figuring out the forms and the implementation of the actions
17-18 July 2012[edit]
- Playing around with the Simple forms extension. Naive html forms wouldn't help as the action can't be hard coded.
- It has some issues with mediawiki 1.20(alpha) due to some deprecations in the mediawiki codebase but figured out a few of them.
11-12 July 2012[edit]
- Upload form on the special page.
- Read up on Google charts embedding. Thoughts on the features required for the frontend.
9-10 July 2012[edit]
- Documentation and fixing the flow. logging cleanup.
- Frontend
5 July 2012[edit]
- Read up the forms implementation for the frontend of mediawiki extension
3 July 2012[edit]
- Web API set up. Mail has been sent to the mailing list asking folks to submit the logs through the API and mail.
- Documentation, implement logging through out.
- Read up about frontend forms for upload and data request.
- The frontend is being setup through a special page which is the view part of the mediawiki extension.
1 July 2012[edit]
- Setting the demo server up. It is hosted at http://88.198.223.105 and that is being configured now for the demo purposes.
- Documentation of the work
30 Jun 2012[edit]
- Integrating all the things worked on. Testing the process.
