#include "common.h"
#include <stdio.h>
#include <strings.h>
#include <math.h>
#include "machine.h"
#include "vmath.h"
#include "plot3.h"
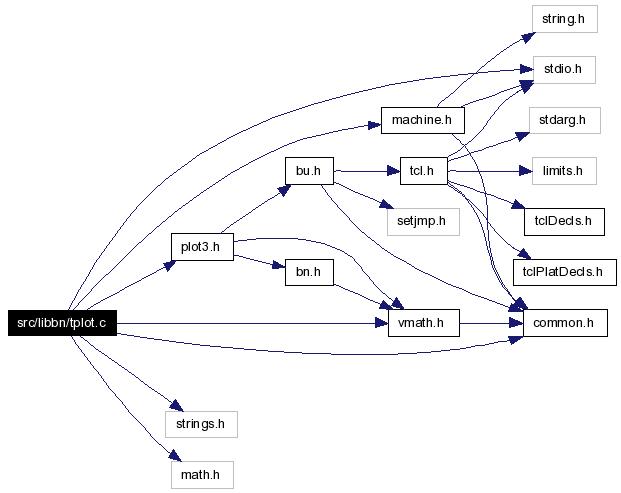
Include dependency graph for tplot.c:
Go to the source code of this file.
Defines | |
| #define | TIC 100 |
| #define | REF_WIDTH 0.857143 |
| #define | NUM_DISTANCE 250 |
| #define | LAB_LNGTH 860 |
Functions | |
| void | tp_ftoa (float x, char *s) |
| This routine converts a floating point number into a string of ascii characters of the form "sX.XXXesXX". The string is null terminated. | |
| void | tp_fixsc (float *x, int npts, float size, float *xs, float *xmin, float *xmax, float *dx) |
| void | tp_sep (float x, float *coef, int *ex) |
| tp_sep() divides a floating point number into a coefficient and an exponent. works in base ten. | |
| double | tp_ipow (double x, int n) |
| tp_ipow() raises a floating point number to a positve integer power. XXX Horribly inefficient! | |
| void | tp_plot (FILE *fp, int xp, int yp, int xl, int yl, char *xtitle, char *ytitle, float *x, float *y, int n, double cscale) |
| void | PL_FORTRAN (fplot, FPLOT) |
George W. Hartwig, Jr. 16 March 1979
This routine is designed to simplify the creation of X,Y plots for user. The user need only furnish this program the data arrays to be plotted, the lengths of the respective axis, titles for the axis, and the point on the page corresponding to data point (0,0). The program will then do everything else required to make the plot appear on the user's terminal including scaling of the data, centering of the titles and positioning on the page.
where
R E V I S I O N H I S T O R Y
WHO WHEN WHAT GWH 5/21/79 Modified ftoa so that nos. < e-15 map to zero. GWH 6/29/79 Changed the axis drawing loops to prevent a one tic mark overrun. GWH 7/10/79 Subtracted one from n to allow for the fact that fortran arrays start at one and not zero as with c.
Definition in file tplot.c.
 1.4.6
1.4.6